Generating Spheres
The purpose of this document is to describe the steps required to prepare active site spheres for a DOCK run. This tutorial uses L-Arabinose-Binding Protein Complex bound to L-Arabinose (pdb code 1ABE) as an example system. However, these techniques should be transferable to any protein-ligand system. All files discussed in this tutorial are linked at the appropriate places and also can be found in the "demo/2_site" folder distributed with DOCK 5.2 and later.
To start this tutorial, you will need the rec_fixed.pdb and the lig_charged.mol2 file from the "Molecule Preparation Tutorial." You will also need the program dms, which you can download from http://www.cgl.ucsf.edu/Overview/software.html.
STEP 1: Generate the molecular surface of target
The molecular surface of the target, based on the algorithm developed by Richards (Ann. Rev. Biophys. Bioeng. 1977. 6:151-176) and adapted by Connolly (M. Connolly, Ph.D. Thesis, University of California, Berkeley, 1981), is generated by rolling a ball the size of a water molecule over the vdw surface of the target. This program is also used to calculate the surface normal vector at each surface point, which will be used later to calculate the size of each sphere. The available options for the dms program are:
USAGE: dms input_file [-a -d density -g file -i file -n -w radius -v] -o file
To generate the surface, use the command "dms rec_fixed.pdb -a -n -w 1.4 -v -o rec.ms" For more information on the contents and format of the output file, see the documentation included in the dms distribution. A graphical representation of the molecular surface, shown in green, is below:
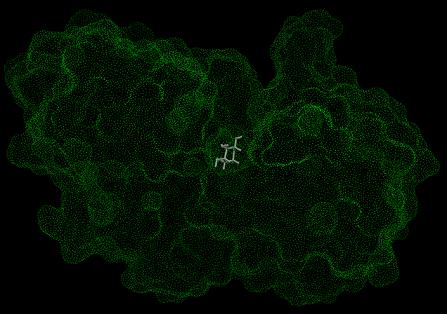
Image generated using Chimera (http://www.cgl.ucsf.edu/chimera)
STEP 2: Generate spheres
To generate spheres from the molecular surface and normal vectors, you need to use the program sphgen that is distributed as an accessory to DOCK (Kuntz et al. J. Mol. Biol. 1982. 161: 269-288).
|
|
|
|
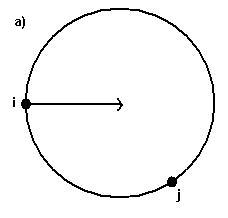
(a) Each sphere is generated tangent to surface points
i, j with the center on the surface normal of point i
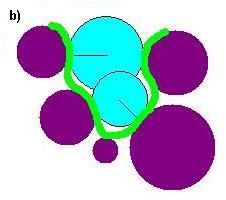
(b)Schematic representation of a small binding site formed by five
atoms (purple). The spheres (blue) are generated using points from
the molecular surface (green) with their centers lying along the
surface normals (thin line).
|
||
Spheres are calculated over the entire surface, producing approximately one sphere per surface point. This dense representation is then filtered to keep only the largest sphere associated with each surface atom. The filtered set is then clustered using a single linkage algorithm. Each resulting cluster represents an evagination in the target. In order to run sphgen, you must generate a file named INSPH, the format of which is below:
|
rec.ms
|
#molecular surface file
|
|---|---|
|
R
|
#sphere outside of surface (R) or inside surface (L)
|
|
X
|
#specifies subset of surface points to be used (X=all
points
|
|
0.0
|
#prevents generation of large spheres with close surface
contacts (default=0.0)
|
|
4.0
|
#maximum sphere radius in Angstroms (default=4.0)
|
|
1.4
|
#minimum sphere radius in Angstroms (default=radius of
probe)
|
|
rec.sph
|
#clustered spheres file
|
To generate the spheres, simply use the command "sphgen" in the same folder that contains the INSPH file. The output will be two files: rec.sph, which contains the spheres in clusters, and OUTSPH, which contains general information about the calculation.
NOTE: For sphgen to work, the comments above - labeled by # - must be removed from the INSPH file. Also, if the calculation has been run before, all output files (including OUTSPH and rec.sph) must be removed from the working directory. Finally, for technical reasons, sphgen cannot handle more than 9999 spheres (CHECK THIS). If you have a large target, we recommend selecting a subsection of the protein using a visualization program and using it to generate the molecular surface and spheres instead.
STEP 3: Select subset of spheres to be used in DOCK
OPTION 1: Use the largest cluster generated by sphgen
The clusters contained in the rec.sph file are ranked according to size (number of spheres in the cluster). In most cases, the largest cluster is typically the ligand binding site of the molecule. To visualize the spheres, you need to use the program showsphere, distributed as an accessory to DOCK. This program also has an input file, shown below:
To convert the selected sphere file to pdb format, use the command "showsphere < sphgen_cluster.in" A picture of the largest cluster for the example in this tutorial can be seen below, where the protein is shown in purple and the spheres are shown in yellow (sphgen_cluster.pdb):
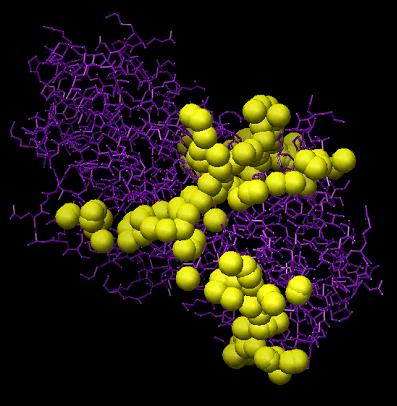
Image generated using Chimera (http://www.cgl.ucsf.edu/chimera)
If you are satisfied with the spheres in this cluster, create a new file containing only the selected cluster (sphgen_cluster.sph).
OPTION 2: Select spheres within some radius of a desired location
If the active site is known, you can select spheres within a radius of a set of atoms that describes the site. To do this, you need to use the program sphere_selector, which is distributed as an accessory with DOCK. The required input for sphere_selector is:
USAGE: sphere_selector <sphere_cluster_file.sph> <set_of_atoms.mol2> <radius>
Here, we select all spheres within 10.0 Angstroms root mean square deviation (RMSD) from every atom of the crystal structure of the ligand, using the command "sphere_selector rec.sph lig_charged.mol2 10.0". These spheres can be visualized using the showsphere program, mentioned in OPTION 1, with the command "showsphere < selected_spheres.in". Below is a picture of the selected spheres (blue) (selected_spheres.pdb):
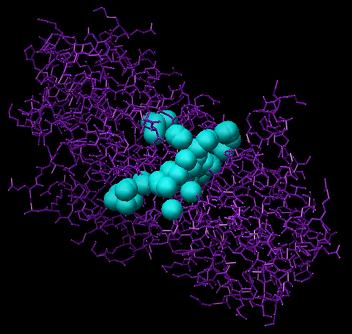
Image generated using Chimera (http://www.cgl.ucsf.edu/chimera)
If you are satisfied with the spheres that have been selected, you can use the output file, selected_spheres.sph, directly in DOCK.
OPTION 3: Add your own spheres
You can add your own sphere centers to the sphgen_cluster.sph file manually. This option can be used if a region of space that is of interest to you is poorly populated by sphgen. To do this, simply add suitable parameters your xxx.sph file in the format below:
FORMAT: (I5, 3F10.5, F8.3, I5, I2, I3) with values corresponding to